Word list
Finn Årup Nielsen
Neurobiology Research Unit,
Rigshospitalet
and
Abstract:
Word list with short explaination in the areas of neuroinformatics and
statistics.
-
- abundance matrix
- A data matrix
 that
contains actual numbers of occurrences or proportions
[Kendall, 1971] according to
[Mardia et al., 1979, exercise 13.4.5].
that
contains actual numbers of occurrences or proportions
[Kendall, 1971] according to
[Mardia et al., 1979, exercise 13.4.5].
- activation function
- The nonlinear
function in the output of the unit in a neural network. Can be a
threshold function, a piece-wise linear function or a sigmoidal
function, e.g., hyperbolic tangent or logistic sigmoid.
If the activation function is on the output of the neural network it
can be regarded as a link function.
- active learning
- 1: The same as focusing [MacKay, 1992b].
2: supervised learning [Haykin, 1994]
- adaptive principal components extraction
- APEX. Artificial neural
network structure with feed-forward and lateral connections to
compute principal components [Kung and Diamantaras, 1990].
- adjacency matrix
- A binary and square matrix
 describing the
connections in a graph consisting of
describing the
connections in a graph consisting of  nodes.
- Akaike's Information criteria
- AIC. Also called ``information
criteria A''
where  is the number of parameters of the model.
- analysis of covariance
- A type of (univariate) analysis of
variance where some of the independent variables are
supplementary/non-interesting -- usually confounds/nuisance
variable -- and used to explain
variation in the dependent variable [Pearce, 1982].
- anti-Hebbian learning
- Modeling by employing a constraint.
- asymmetric divergence
- Equivalent to the relative entropy.
- author cocitation analysis
- Analysis of the data formed when a
(scientific) paper cites two different authors.
The performed with, e.g., cluster analysis
[McCain, 1990]. An overview of author cocitation analysis
is available in [Lunin and White, 1990].
- auto-association
- Modeling with the input the same as the
output.
- backpropagation
- 1: The method to find the
(first-order) derivative of a multilayer neural network.
2: The method of adjusting (optimizing) the parameters in a multilayer
neural network.
- Bayes factor
- A ratio of evidences
 |
(2) |
where
 and
and
 are hypotheses, models or
hyperparameters.
See, e.g., [Kass and Raftery, 1995] and attributed to Turing and
Jeffreys.
are hypotheses, models or
hyperparameters.
See, e.g., [Kass and Raftery, 1995] and attributed to Turing and
Jeffreys.
- Bayesian information criterion
- (BIC) Also called Schwarz
(Bayesian) (information) criterion (SBC)
- bias
- 1: A threshold unit in a neural network.
2: A models inability to model the true system.
3: The difference between the mean estimated model and
the true model. 4: The difference between the mean of an estimator and
the true value.
- bias-variance trade-off
- The compromise between the simplicity
of the model (which causes bias) and complexity (which causes
problems for estimation and results in variance) [Geman et al., 1992].
- binary matrix
- A matrix with elements as either one or zero.
Also called a (0,1)-matrix.
- bootstrap
- A resampling scheme that samples with replacement in
the sample, and it is useful to assess the accurary of an
estimate. See, e.g., [Zoubir and Boashash, 1998].
- Burt matrix
- A product matrix of an indicator matrix
[Burt, 1950] [Jackson, 1991, p. 225]:

- canonical correlation analysis
- A type of multivariate analysis.
- canonical variable analysis
- A set of different multivariate
analyses.
- canonical variate analysis
- Canonical correlation
analysis for discrimination, i.e., with categorical variables.
- central moment
- k'th-order sample central moment
 |
(5) |
- cluster
- 1: In SPM99 a region in a thresholded SPM which voxels
are connected. 2: In cluster analysis a set of voxels (or other
objects) assigned together and associated with a ``center''.
- cluster analysis
- An unsupervised method to group data points.
A specific method is K-means.
- clustering
- 1: The tendency of data points to be unequally
distributed in, e.g., space or time.
2: cluster analysis.
- coefficient of variance
- The standard deviation normalized by
the mean
coefficient of variance |
(6) |
Sometimes found with the abbreviations COV or CoV.
- cognition
- 1: Any mental process.
2: A mental process that is not sensor-motoric or emotional.
3: The process involved in knowing, or the act of
knowing (Encyclopaedia Britannica Online)
- complete likelihood
- (Complete-data likelihood)
The joint propability density of observed and unobserved variables
 |
(7) |
where  is observed and
  is hidden
(data/parameters) and
is hidden
(data/parameters) and
 is the parameters.
- conditional (differential) entropy
-
 |
(8) |
- conditional probability density function
-
 |
(9) |
Here the probability density for  given y.
- confound
- (usual meaning) A nuisance variable that is correlated with the
variable of interest.
- conjugate prior
- (Also ``natural conjugate prior'') An
informative prior ``which have a functional form which integrates
naturally with data measurements, making the
inferences have an analytically convenient form''
[MacKay, 1995].
Used for regularization.
- consistent
- An estimator is consistent if the variance of the
estimate goes to zero as more data (objects) are gathered.
- contrast
- In (general) linear modeling: A vector
 for a linear
combination of parameters that sum to zero.
Vectors associated with estimable linear combinations of the
parameters that do not sum to zero are sometimes also called --
against definition --
`contrasts' [Nichols, 2002].
for a linear
combination of parameters that sum to zero.
Vectors associated with estimable linear combinations of the
parameters that do not sum to zero are sometimes also called --
against definition --
`contrasts' [Nichols, 2002].
- cost function
- The function that is optimized.
Can be developed via maximum likelihood from a distribution
assumption between the target and the model output.
Other names are Lyapunov function (dynamical systems),
energy function (physics),
Hamiltonian (statistical mechanics),
objective function (optimization theory),
fitness function (evolutionary biology).
[Hertz et al., 1991, page 21-22].
- cross-entropy
-
 |
(10) |
Equivalent to the sum of the relative entropy and
the entropy (of the distribution the relative entropy is measured
with respect to).
Can also be regarded as the average negative log-likelihood, e.g.,
with
 as a modeled density and
 as the true
unknown density [Bishop, 1995, pages 58-59].
as the true
unknown density [Bishop, 1995, pages 58-59].
- cross-validation
- Empirical method to assess model performance,
where the data set is split in two: One set that is used to estimate
the parameters of the model and the other set that is used to
- data matrix
- A matrix
in which number
of
-dimensional multivariate measurements are represented, see,
e.g.,
[Mardia et al., 1979, sec. 1.3].
- dependence
- In the statistical sense: If two
random variables are
dependent then one of the random variables convey information about
the value of the other.
While correlation is only related to the probability density
function with the two first moments,
dependency is related to all the moments.
- dependent variable
- The variable to be explained/predicted from
the independent variable. The output of the model.
Often denoted
 .
.
- design matrix
- A matrix containing the ``independent'' variables
in a multivariate regression analysis.
- differential entropy
- Entropy for continuous distributions
 |
(11) |
Often just called ``entropy''.
- directed divergence
- Equivalent to relative entropy according to
[Haykin, 1994].
- eigenimage
- An eigenvector associated with a principal component
from a principal component analysis that can be interpreted as an
image or volume.
- empirical Bayes
- Bayesian technique where the prior is specified
from the sample information
- entropy
- A measure for the information content or
degree of
disorder.
- elliptic distribution / elliptically contour distribution
- A
family of distribution with elliptical contours.
![$\displaystyle p({\bf x}) = \vert{\boldsymbol \Sigma}\vert^{-1/2} \psi \left[ ({...
...mbol \mu})^{\sf T}{\boldsymbol \Sigma}^{-1} ({\bf x}-{\boldsymbol \mu}) \right]$](img27.png) |
(12) |
The distribution contains the Gaussian distribution, the
multivariate  distribution, the contaminated normal,
multivariate Cauchy and multivariate logistic distribution
distribution, the contaminated normal,
multivariate Cauchy and multivariate logistic distribution
- estimation
- The procedure to find the model or the parameters of
the model. In the case or parameters: a single value for each
parameter in, e.g., maximum likelihood estimation, or a distribution
of the parameters in Bayesian technique.
- evidence
- The probability of the data given the
model or hyperparameters [MacKay, 1992a].
``Likelihood for hyperparameters'' or
``likelihood for models'', e.g.,
 .
Found by integrating the parameters of the model
.
Found by integrating the parameters of the model
 |
(13) |
This is the same as ``integrated likelihood'' or ``marginal
likelihood''.
- expectation maximization
- A special group of optimization
methods for models with unobserved data [Dempster et al., 1977].
- explorative statistics
- Statistics with the aim of generating
hypotheses rather than testing hypothesis.
- feed-forward neural network
- A nonlinear model.
- finite impulse response (model)
- A linear model with a finite
number of input lags and a single output.
- fixed effect model
- Model where the parameters are not random
[Conradsen, 1984, section 5.2.2]. See also random effects model and mixed effects model.
- F-masking
- Reduction of the number of voxels analyzed using a
F-test.
- Frobenius norm
- Scalar descriptor of a matrix
[Golub and Van Loan, 1996, equation 2.3.1].
The same as the square root of the sum of the singular values
[Golub and Van Loan, 1996, equation 2.5.7].
 |
(14) |
- full width half maximum
- Used in specification of filter width,
related to the standard deviation for a Gaussian kernel by
FWHM |
(15) |
- functional integration
- The notion that brain region interact or
combine in solving a mental task.
Brain data in this connection is usually modeled with
multivariate statistical methods [Friston, 1997].
- functional segregation
- The issue in analyses of
brain data with univariate statistical methods [Friston, 1997].
- functional volumes modeling
- Meta-analysis in Talairach space,
-- a term coined in [Fox et al., 1997].
- Gauss-Newton (method)
- Newton-like optimization method that uses
the ``inner product'' Hessian.
- general linear hypothesis
- Hypotheses associated with the multivariate regression model of the
form [Mardia et al., 1979, section 6.3]
 |
(16) |
In many case the the hypothesis is of a simple type
testing only for difference between the rows
|
 |
(17) |
In the univariate case it becomes yet simpler
|
 |
(18) |
- general linear model
- A type of multivariate regression
analysis, usually where the independent variables are a design
matrix.
- generalized additive models
- A group of nonlinear models
proposed by [Hastie and Tibshirani, 1990]:
Each input variable is put through a non-linear function. All
transformed input variable is then used in a multivariate linear
regression, and usually with a logistic sigmoid function on the
output. In the notation of [Bishop, 1995]:
 |
(19) |
- generalized inverse
- An ``inverse'' of a square or rectangular
matrix.
If
 denotes the generalized inverse of
  then it
will satisfy some of the following Penrose equations
(Moore-Penrose conditions)
[Golub and Van Loan, 1996, section 5.5.4] and [Ben-Israel and Greville, 1980]:
then it
will satisfy some of the following Penrose equations
(Moore-Penrose conditions)
[Golub and Van Loan, 1996, section 5.5.4] and [Ben-Israel and Greville, 1980]:
where  denotes the conjugate, i.e., transposed matrix if
is real.
A matrix that satisfy all equations is uniquely determined and
called the Moore-Penrose inverse and (often) denoted as
denotes the conjugate, i.e., transposed matrix if
is real.
A matrix that satisfy all equations is uniquely determined and
called the Moore-Penrose inverse and (often) denoted as
 .
.
- generalized least squares
- 1: Regression with correlated
(non-white) noise, thus were the noise covariance matrix is not
diagonal, see, e.g.,
[Mardia et al., 1979, section 6.6.2]. 2: The
Gauss-Newton optimization method.
- generalized linear model
- An ``almost'' linear model where the
output of the model has a link function for modeling
non-Gaussian distributed data.
- Good-Turing frequency estimation
- A type of regularized frequency
estimation [Good, 1953].
Often used in word frequency analysis [Gale and Sampson, 1995].
- Gram matrix
- A Gram matrix is Hermitian and constructed from a data matrix
with -dimensional vectors

 |
(24) |
i.e., the elements of the Gram matrix
 are the
dot products between all possible vectors
are the
dot products between all possible vectors
 .
.
- gyrification index
- An index for the degree of folding of the cortex
GI |
(25) |
There are no folding for
GI and folding for
GI
and folding for
GI .
.
- hard assignment
- Assignment of a data point to one (and only
one) specific component, e.g., cluster in cluster analysis or
mixture component in mixture modeling.
- Hebbian learning
- Estimation in a model where the magnitude of a
parameter is determined on how much it is ``used''.
- hemodynamic response function
- The coupling between neural
and vascular activity.
- heteroassociation
- Modeling where the input and output are
different, e.g., ordinary regression analysis.
- homogeneity
- Stationarity under translation.
- hyperparameter
- A parameter in a model that is used in the
estimation of the model but has no influence on the response of the
estimated model if changed.
An example of a hyperparameter is weight decay
- identification
- Estimation
- ill-posed
- A problem is ill-posed if the singular values of the
associated matrix gradually decay to zero
[Hansen, 1996], cf. rank deficient
- Imax
- Algorithms maximizing the mutual information (between
outputs) [Becker and Hinton, 1992].
- incidence matrix
- A binary matrix with size (nodes
 links)
[Mardia et al., 1979, p. 383]:
links)
[Mardia et al., 1979, p. 383]:
 .
Also called indicator matrix.
.
Also called indicator matrix.
- incomplete likelihood
- A marginal density marginalized over hidden data/parameters.
- indicator matrix
- A data matrix with elements one or zero
[Jackson, 1991, p. 224]:
.
- information criterion
- Includes Akaike's information criteria (AIC), Bayesian information
criterion (BIC), (Spiegelhalter's) Bayesian deviance information
criterion (DIC), ...
- inion
- The external occipital protuberance of the skull
(Webster). Used as marker in EEG. Opposite the nasion.
See also: nasion, peri-auri
- integrated likelihood
- The same as the evidence.
- International Consortium for Brain Mapping
- (Abbreviation: ICBM)
Group of research institutes.
They have developed a widely used brain template know as the ICBM or
MNI template.
- inversion
- In the framework of input-system-output: To find the
input from the system and the output.
- isotropy
- Stationarity under rotation.
- Karhunen-Lóeve transformation
- The same as principal
component analysis. The word is usually used in communication theory.
- kernel density estimation
- Also known as Parzen windows and
probabilistic neural network.
- K-means
- Cluster analysis algorithm with hard assignment.
- k-nearest neighbor
- A classification technique
- knowledge
- Information that has been placed in a context.
- Kullback-Leibler distance
- Equivalent to relative
entropy.
- kurtosis
- Normalized fourth order central moment.
The univariate Fisher kurtosis
 is defined as
 |
(28) |
where  and
and  are the fourth and second central moment,
respectively.
are the fourth and second central moment,
respectively.
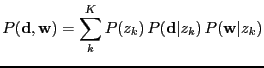
- latent class analysis
- Also called latent class decomposition.
A decomposition of a contingency table (multivariate categorical)
into
 latent classes, see, e.g., [Hofmann, 2000].
The observed variables are often called manifest variables.
latent classes, see, e.g., [Hofmann, 2000].
The observed variables are often called manifest variables.
 |
(29) |
- latent semantic indexing
- Also ``latent semantic analysis''. Truncated singular value decomposition
applied on a bag-of-words data matrix [Deerwester et al., 1990].
- lateral orthogonalization
- Update method (``anti-Hebbian
learning'') or connections between the units in the
same layer in a neural network
which impose orthogonality between the different units, i.e., a kind
of deflation technique.
Used for connectionistic variations of singular value decomposition,
principal component analysis and partial least squares among
others, see, e.g., [Hertz et al., 1991, pages 209-210] and
[Diamantaras and Kung, 1996, section 6.4].
- learning
- In the framework of input-system-output: To find the
system from (a set of) inputs and outputs.
In some uses the same as estimation and training.
- leave-one-out
- A cross-validation scheme where each data point
in turn is kept in the validation/test set while the rest is used
for training the model parameters.
- likelihood
- A function where the data is fixed and the
parameters are allowed to vary
 |
(30) |
- link function
- A (usually monotonic) function on the output of a
linear model that is used in generalized linear models to model
non-Gaussian distributions.
- lix
- Number for the readability of a text [Björnsson, 1971].
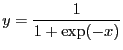
- logistic (sigmoid) (function)
- A monotonic function used as a link function to convert a variable
in the range
![$ ]-\infty; \infty[$](img72.png) to the range
to the range ![$ [0; 1]$](img73.png) suitable for
interpretation as a probability
suitable for
interpretation as a probability
 |
(31) |
- manifold
- A non-linear subspace in a high dimensional space. A
hyperplane is an example on a linear manifold.
- Mann-Whitney test
- A non-parametric test for a translational
difference between to distributions by the application of a rank
transformation. Essentially the same as the Wilcoxon rank-sum test,
though another statistics is used: The `Mann-Whitney
 -statistics'
- marginal likelihood
- The same as the evidence and the
``integrated likelihood''.
- marked point process
- A point process where each point has an extra attribute apart from
its location, e.g., a value for its magnitude.
- Markov chain Monte Carlo
- Sampling
technique in simulation and Bayesian statistics.
- mass-univariate statistics
- Univariate statistics when applied
to several variables.
- matching prior
- A prior in Bayesian statistics that is selected so posterior
credible sets resemble frequentist probabilities.
- maximal eigenvector
- The eigenvector associated with the largest
eigenvector.
- maximum a posteriori
- Maximum likelihood estimation ``with prior''.
- maximum likelihood
- A statistical estimation principal with
optimization of the likelihood function
- m-estimation
- Robust statistics.
- Metropolis-Hasting algorithm
- Sampling technique for Markov
chain Monte Carlo. [Metropolis et al., 1953]
- mixed effects model
- Type of ANOVA that consists
of random and fixed effects
[Conradsen, 1984, section 5.3].
See also fixed effects model and random effects model.
- Moore-Penrose inverse
- A generalized inverse that satisfy all
of the ``Penrose equations'' and is uniquely defined
[Penrose, 1955].
- multiple regression analysis
- A type of multivariate regression
analysis where there is only one response variable (
 .
.
- multivariate analysis
- Statistics with more than one variable is
each data set,
as opposed to univariate statistics.
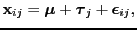
- multivariate analysis of variance
- (MANOVA) Type of analysis of
variance with multiple measures for each `object' or experimental
design.
One-way MANOVA can be formulated as
[Mardia et al., 1979, section 12.2]
 |
(32) |
where
 is observations (`responses' or `outcomes'),
 is the general effect,
 are the
condition effects and
are the
condition effects and
 is the noise often assumed
to be independent Gaussian distributed.
The most common test considers the difference in condition effect
is the noise often assumed
to be independent Gaussian distributed.
The most common test considers the difference in condition effect
 |
(33) |
- multivariate regression analysis
- A type of linear multivariate analysis using the following model
 |
(34) |
is an observed matrix and is a known
matrix.  is the parameters and
  is the noise
matrix.
The model is either called multivariate regression model (if is observed) or general
linear model (if is ``designed'').
[Mardia et al., 1979, chapter 6]
is the noise
matrix.
The model is either called multivariate regression model (if is observed) or general
linear model (if is ``designed'').
[Mardia et al., 1979, chapter 6]
- multivariate regression model
- A type of multivariate
regression analysis where the known matrix () is observed.
- mutual information
- Originally called
``information rate'' [Shannon, 1948].
- nasion
- The bridge of the nose. Opposite the inion.
See also: inion, and periauricular points.
Used as reference point in EEG.
- neural network
- A model inspired by biological
neural networks.
- neurological convention
- Used in connection with transversal or
axial images of the brain to denote the left side of the image
is to the left side of the brain, - as opposed to the ``radiological
convention''.
- non-informative prior
- A prior with little effect on the
posterior, e.g., an uniform prior or Jeffreys' prior.
Often improper, i.e., not normalizable.
- non-parametric (model/modeling)
- 1: A non-parametric model is a
model where the parameters do not have a direct physical meaning.
2: A model with no direct parameters. [Rasmussen and Ghahramani, 2001]:
[...] models which we do not necessarily know the roles played by
individual parameters, and inference is not primarily targeted at
the parameters themselves, but rather at the predictions made by
the models
- novelty
- ``Outlierness''. How ``surprising'' an object is.
- nuisance
- a variable of no interest in the modeling that
makes the estimation of the variable of interest more difficult.
See also confound.
- object
- A single ``data point'' or ``example''.
A single instance of an observation of one or more variables.
- optimization
- Used to find the point estimate of a
parameter. ``Optimization'' is usually used when the estimation requires
iterative parameter estimation, e.g., in connection with nonlinear
models.
- ordination
- The same as multidimensional scaling.
- orthogonal
- For matrices: Unitary matrix with no
correlation among the (either column or row) vectors.
- orthonormal
- For matrices: Unitary matrix with no correlation
among the (either column or row) vectors.
- pairwise interaction point process
- A spatial point process that is a specialization of the Gibbsian
point process [Ripley, 1988, page 50]
- partial least squares (regression)
- Multivariate analysis
technique usually with multiple response variables
[Wold, 1975]. Much used in chemometrics.
- Parzen window
- A type of probability density function model
[Parzen, 1962] where a window (a kernel) is placed at
every object. The name is used in the pattern recognition
literature and more commonly known as kernel density estimation.
- penalized discriminant analysis
- (Linear) discriminant analysis
with regularization.
- perceptron
- A (multilayer) feed-forward neural network
[Rosenblatt, 1962].
- periauricular
- See also: nasion, inion
- periodogram
- The power spectrum
 of a finite signal where
is the complex frequency spectrum and
of a finite signal where
is the complex frequency spectrum and
The term is also use for the power spectrum of a
rectangular-windowed signal.
- polysemy
- The notion of a single word having several meanings.
The opposite of synonymy.
- preliminary principal component analysis
- Principal component
analysis made prior to a supervised modeling, e.g., an artificial
neural network analysis or canonical variate analysis.
- prediction
- In the framework input-system-output: To find the
output from the input and system.
- principal component analysis
- (PCA) An unsupervised multivariate
analysis that identifies an orthogonal transformation and remaps
objects to a new subspace with the transformation
[Pearson, 1901], [Mardia et al., 1979, page 217].
 |
(43) |
An individual elemenent in  is called a score. The
  'th
column in is called the 'th principal component.
'th
column in is called the 'th principal component.
- principal component regression
- Regularized regression by
principal component analysis [Massy, 1965].
- principal coordinate analysis
- A method in multidimensional
scaling. Similar to principal component analysis on a distance
matrix if the distance measure is Euclidean
[Mardia et al., 1979, section 14.3].
- principal covariate regression
- Multivariate analysis technique
[de Jong and Kiers, 1992].
- principal manifold
- Generalization of principal
curves, a non-linear version of principal component analysis.
[DeMers and Cottrell, 1993]
- prior
- Distribution of parameters before observations have been made. Types
of priors are: uniform, non-informative, Jeffrey's, reference, matching,
informative, (natural) conjugate.
- probabilistic neural network
- A term used to denote kernel density
estimation [Specht, 1990].
- probabilistic principal component analysis
- Principal component
analysis with modeling of a isotropic noise
[Tipping and Bishop, 1997]. The same as sensible principal
component analysis.
- profile likelihood
- A likelihood where some of the variables -- e.g., nuisance variables
-- are maximized [Berger et al., 1999, equation 2]
 |
(44) |
- radiological convention
- Used in connection with transversal or
axial images of the brain to denote the right side of the image
is to the left side of the brain, - as opposed to the ``neurological
convention''.
- random effects model
- Type of ANOVA where the parameters (on
the ``first'' level'') are regarded as random
[Conradsen, 1984, section 5.2.3]. See also fixed
effects model and mixed effects model.
- rank
- The size of a subspace span by the vectors in a matrix
- rank deficient
- A matrix is said to be rank deficient if there
is a well-defined gap between large and small singular values
[Hansen, 1996], cf. ill-posed.
- regularization
- The method of stabilizing the model estimation.
- relative entropy
- A distance measure between two distributions
[Kullback and Leibler, 1951].
 |
(45) |
Other names are cross-entropy,
Kullback-Leibler distance (or information criterion), asymetric
divergence, directed divergence.
- responsibility
- In cluster analysis and mixture modeling the
weight of assignment to a particular cluster for a specific data
point .
With probabilistic modelling this can be interpreted as a posterior
probability
 |
(46) |
- restricted canonical correlation analysis
- (RCC) Canonical
correlation analysis with restriction on the parameters, e.g.,
non-negativity [Das and Sen, 1994,Das and Sen, 1996].
- robust statistics
- Statistics designed to cope with outliers.
- run
- A part of an experiment consisting of several measurements,
e.g., several scans. The measurements in a run is typically done
with a fixed frequency. Multiple runs can be part of a session and a
run might consist of one or more trials or events.
- saliency map
- A map of which inputs are important for predicting
the output.
- saturation recovery
- Type of MR pulse sequence.
- self-organizing learning
- The same as unsupervised learning
- sensible principal component analysis
- Principal component
analysis with modeling of an isotropic noise
[Roweis, 1998]. The same as probabilistic
principal component analysis [Tipping and Bishop, 1997]
- session
- A part of the experiment: An experiment might consists
of multiple sessions with multiple subjects and every session
contain one or more runs.
- sigmoidal
- S-shaped. Often used in connection about the
non-linear function in an artificial neural network.
- skewness
- The left/right asymmetry of a distribution.
The usual definition is
 |
(47) |
where  and are the third and second central moment.
Multivariate skewness can be defined as
[Mardia et al., 1979, p. 21, 148+]
and are the third and second central moment.
Multivariate skewness can be defined as
[Mardia et al., 1979, p. 21, 148+]
- slice timing correction
- In fMRI: Correction for the difference
in sampling between slices in a scan.
Slices can acquired interleaved/non-interleaved and
ascending/descending.
- softmax
- A vector function that is a generalization of the
logistic sigmoid activation function suitable to transform the
variables in a vector from the interval
to so they can be used as probabilities [Bridle, 1990]
 |
(50) |
- sparseness
- The sparseness of the matrix is the number of
non-zero elements to the total number of elements.
Another definition is a function of the  and
and  norm
[Hoyer, 2004, p. 1460]
norm
[Hoyer, 2004, p. 1460]
 |
(51) |
- spatial independent component analysis
- Type of independent
component analysis in functional neuroimaging
[Petersson et al., 1999]. See also temporal component analysis.
- statistic
- A value extracted from a data set, such as the
empirical mean or the empirical variance.
- statistical parametric images
- A term used by Peter T. Fox et
al. to denote the images that are formed by statistical
analysis of functional neuroimages.
- statistical parametric mapping
- The process of getting
statistical parametric maps: Sometimes just denoting voxel-wise
t-tests, other times ANCOVA GLM modeling with random fields modeling,
and sometimes also including the preprocessing: realignment, spatial
normalization, filtering, ...
- statistical parametric maps
- A term used by Karl J. Friston and
others to denote the images that are formed by statistical
analysis of functional neuroimages, especially those formed from the
program SPM.
- subgaussian
- A distribution with negative kurtosis, e.g., the
-uniform distribution. Also called
`platykurtic'.
- sufficient
- A statistics (function)
 is
sufficient if it is ``enough'' to estimate the parameters of the
model ``well'', -- or more specifically: Enough to described the
likelihood function within a scaling factor.
The likelihood can then be factorized:
is
sufficient if it is ``enough'' to estimate the parameters of the
model ``well'', -- or more specifically: Enough to described the
likelihood function within a scaling factor.
The likelihood can then be factorized:
 |
(52) |
- supergaussian
- A distribution with positive kurtosis, i.e., a
heavy-tailed distribution such as the Laplace distribution.
Also called `leptokurtic'.
- supervised (learning/pattern recognition)
- Estimation of a model
to estimate a ``target'', e.g., classification (the target is the
class label) or regression (the target is the dependent variable)
estimation with labeled data.
- synonymy
- The notion that several words have the same meaning.
The opposite of polysemy.
- system
- The part of the physical world under
investigation. Interacts with
the environment through input and output.
- system identification
- In the framework of input-system-output:
To find the system from (a set of) inputs and outputs.
The same as learning, although system identification
usually refers to parametric learning.
- temporal independent component analysis
- Type of independent
component in functional neuroimaging
[Petersson et al., 1999].
See also spatial independent component analysis
- test set
- Part of a data set used to test the performance (fit)
of a model. If the estimate should be unbiased the test set should
be independent of the training and validation set.
- time-activity curve
- The curve generated in connection with
dynamic positron emission tomography (PET) images
- total least square
- Multivariate analysis estimation technique
- training
- Term used in connection with neural networks to denote
parameter estimation (parameter optimization). Sometimes called
learning.
- training set
- Part of a data set used to fit the parameters of the
model (not the hyperparameters). See also test and validation set.
- trial
- An element of a psychological experiment usually
consisting of a stimulus and a response.
- truncated singular valued decomposition
- Singular value
decomposition of a matrix
where only a number
of components, say
 rank
rank , are maintained
 |
(53) |
where the diagonal  is
is
![$ [ l_1, l_2, l_3, 0, \ldots, 0 ]$](img122.png) .
The truncated SVD matrix is the -ranked matrix with minimum
2-norm and Frobenius norm of the difference between all -ranked
matrices and .
.
The truncated SVD matrix is the -ranked matrix with minimum
2-norm and Frobenius norm of the difference between all -ranked
matrices and .
- univariate statistics
- Statistics with only one response variable, as
opposed to multivariate analysis.
- unsupervised learning
- Learning with only one set of data, --
there is no target involved.
Cluster analysis and principal component analysis is usually regarded as
unsupervised.
- variational Bayes
- An extension of the EM algorithm were both the hidden variables and
the parameters are associated with probability density functions
(likelihood and posteriors).
With observed , hidden and parameters
 |
 |
(54) |
...
- voxel
- A 3-dimensional pixel. The smallest picture element in a
volumetric image.
- validation set
- Part of a data set used to tune
hyperparameters.
- vector space model
- In information retrieval: Representation of
a document as a vector where each element is (usually) associated
with a word [Salton et al., 1975].
The same as the bag-of-words representation.
- weights
- E.g., the model parameters of a neural network.
- white noise
- Noise that is independent (in the time dimension).
- z-score
- Also called ``standard score'' and denotes a random
variable transformed so the mean is zero and the standard
deviation is one. For a normal distributed random variable the
transformation is:
 |
(55) |
- Becker and Hinton, 1992
-
Becker, S. and Hinton, G. E. (1992).
A self-organizing neural network that discovers surfaces in
random-dot stereograms.
Nature, 355(6356):161-163.
- Ben-Israel and Greville, 1980
-
Ben-Israel, A. and Greville, T. N. E. (1980).
Generalized Inverses: Theory and Applications.
Robert E. Krieger Publishing Company, Huntington, New York, reprint
edition edition.
- Berger et al., 1999
-
Berger, J. O., Liseo, B., and Wolpert, R. L. (1999).
Integrated likelihood methods for eliminating nuisance parameters
(with discussion).
Statistical Science, 14:1-28. http://ftp.isds.duke.edu/WorkingPapers/97-01.ps. CiteSeer:
http://citeseer.ist.psu.edu/berger99integrated.html.
- Bishop, 1995
-
Bishop, C. M. (1995).
Neural Networks for Pattern Recognition.
Oxford University Press, Oxford, UK. ISBN 0198538642 [
bibliotek.dk
| isbn.nu ]
.
- Björnsson, 1971
-
Björnsson, C. H. (1971).
Læsbarhed.
GEC, Copenhagen.
- Bridle, 1990
-
Bridle, J. S. (1990).
Probalistic interpretation of feedforward classification network
outputs, with relationships to statistical pattern recognition.
In Fogelman Soulié, F. and Hérault, J., editors, Neurocomputing: Algorithms, Architectures and Application, pages 227-236.
Springer-Verlag, New York.
- Burt, 1950
-
Burt, C. (1950).
The factorial analysis of qualitative data.
British Journal of Statistical Psychology (Stat. Sec.),
3:166-185.
- Conradsen, 1984
-
Conradsen, K. (1984).
En Introduktion til Statistik.
IMSOR, DTH, Lyngby, Denmark, 4. edition.
In Danish.
- Das and Sen, 1994
-
Das, S. and Sen, P. K. (1994).
Restricted canonical correlations.
Linear Algebra and its Applications, 210:29-47.
http://www.sciencedirect.com/science/article/B6V0R-463GRJ4-3/2/2570d4ea8024361049d6def4f4bb9716.
- Das and Sen, 1996
-
Das, S. and Sen, P. K. (1996).
Asymptotic distribution of restricted canonical correlations and
relevant resampling methods.
Journal of Multivariate Analysis, 56(1):1-19.
DOI: 10.1006/jmva.1996.0001. http://www.sciencedirect.com/science/article/B6WK9-45NJFKB-14/2/44c1e203190336d7ebbb18bc09cda8b7.
- de Jong and Kiers, 1992
-
de Jong, S. and Kiers, H. A. L. (1992).
Principal covariates regression.
Chemometrics and Intelligent Laboratory Systems, 14:155-164.
- Deerwester et al., 1990
-
Deerwester, S., Dumais, S. T., Furnas, G. W., Landauer, T. K., and Harshman, R.
(1990).
Indexing by latent semantic analysis.
Journal of the American Society for Information Science,
41(6):391-407. http://www.si.umich.edu/~furnas/POSTSCRIPTS/LSI.JASIS.paper.ps.
CiteSeer:
http://citeseer.ist.psu.edu/deerwester90indexing.html.
- DeMers and Cottrell, 1993
-
DeMers, D. and Cottrell, G. W. (1993).
Nonlinear dimensionality reduction.
In Hanson, S. J., Cowan, J. D., and Lee Giles, C., editors, Advances in Neural Information Processing Systems: Proceedings of the 1992
Conference, pages 580-587, San Mateo, CA. Morgan Kaufmann Publishers.
NIPS-5.
- Dempster et al., 1977
-
Dempster, A. P., Laird, N. M., and Rubin, D. B. (1977).
Maximum likelihood from incomplete data via the EM algorithm.
Journal of the Royal Statistical Society, Series B, 39:1-38.
- Diamantaras and Kung, 1996
-
Diamantaras, K. I. and Kung, S.-Y. (1996).
Principal Component Neural Networks: Theory and Applications.
Wiley Series on Adaptive and Learning Systems for Signal Processing,
Communications, and Control. Wiley, New York.
ISBN 0471054364 [
bibliotek.dk
| isbn.nu ]
.
- Fox et al., 1997
-
Fox, P. T., Lancaster, J. L., Parsons, L. M., Xiong, J.-H., and Zamarripa, F.
(1997).
Functional volumes modeling: Theory and preliminary assessment.
Human Brain Mapping, 5(4):306-311. http://www3.interscience.wiley.com/cgi-bin/abstract/56435/START.
- Friston, 1997
-
Friston, K. J. (1997).
Basic concepts and overview.
In SPMcourse, Short course notes, chapter 1. Institute of
Neurology, Wellcome Department of Cognitive Neurology. http://www.fil.ion.ucl.ac.uk/spm/course/notes.html.
- Gale and Sampson, 1995
-
Gale, W. A. and Sampson, G. (1995).
Good-Turing frequency estimation without tears.
Journal of Quantitative Linguistics, 2:217-237.
- Geman et al., 1992
-
Geman, S., Bienenstock, E., and Doursat, R. (1992).
Neural networks and the bias/variance dilemma.
Neural Computation, 4(1):1-58.
- Golub and Van Loan, 1996
-
Golub, G. H. and Van Loan, C. F. (1996).
Matrix Computation.
John Hopkins Studies in the Mathematical Sciences. Johns Hopkins
University Press, Baltimore, Maryland, third edition.
ISBN 0801854148 [
bibliotek.dk
| isbn.nu ]
.
- Good, 1953
-
Good, I. J. (1953).
The population frequencies of species and the estimation of
population parameters.
Biometrika, 40(3 and 4):237-264.
- Hansen, 1996
-
Hansen, P. C. (1996).
Rank-Deficient and Discrete Ill-Posed Problems.
Polyteknisk Forlag, Lyngby, Denmark. ISBN 8750207849 [
bibliotek.dk
| isbn.nu ]
.
Doctoral Dissertation.
- Hastie and Tibshirani, 1990
-
Hastie, T. J. and Tibshirani, R. J. (1990).
Generalized Additive Models.
Chapman & Hall, London.
- Haykin, 1994
-
Haykin, S. (1994).
Neural Networks.
Macmillan College Publishing Company, New York.
ISBN 0023527617 [
bibliotek.dk
| isbn.nu ]
.
- Hertz et al., 1991
-
Hertz, J., Krogh, A., and Palmer, R. G. (1991).
Introduction to the Theory of Neural Computation.
Addison-Wesley, Redwood City, Califonia, 1st edition.
Santa Fe Institute.
- Hofmann, 2000
-
Hofmann, T. (2000).
Learning the similarity of documents: An information geometric
approach to document retrieval and categorization.
In Solla, S. A., Leen, T. K., and Müller, K.-R., editors, Advances in Neural Information Processing Systems 12, pages 914-920,
Cambridge, Massachusetts. MIT Press. ISSN 1049-5258 [ bibliotek.dk ] . ISBN 0262194503 [
bibliotek.dk
| isbn.nu ]
.
- Hoyer, 2004
-
Hoyer, P. O. (2004).
Non-negative matrix factorization with sparseness constraints.
Journal of Machine Learning Research, 5:1457-1469.
http://www.jmlr.org/papers/volume5/hoyer04a/hoyer04a.pdf.
- Jackson, 1991
-
Jackson, J. E. (1991).
A user's guide to principal components.
Wiley Series in Probability and Mathematical Statistics: Applied
Probability and Statistics. John Wiley & Sons, New York.
ISBN 0471622672 [
bibliotek.dk
| isbn.nu ]
.
- Kass and Raftery, 1995
-
Kass, R. E. and Raftery, A. E. (1995).
Bayes factors.
Journal of the American Statistical Association,
90(430):773-795. A review about Bayes factors.
- Kendall, 1971
-
Kendall, D. G. (1971).
Seriation from abundance matrices.
In Hodson, F. R., Kendall, D. G., and Tantu, P., editors, Mathematics in the Archeological and Historical Sciences, pages 215-251.
Edinburgh University Press.
- Kullback and Leibler, 1951
-
Kullback, S. and Leibler, R. A. (1951).
On information and sufficiency.
Annals of Mathematical Statistics, 22:79-86.
- Kung and Diamantaras, 1990
-
Kung, S. Y. and Diamantaras, K. I. (1990).
A neural network learning algorithm for adaptive principal component
extraction (APEX).
In International Conference on Acoustics, Speech, and Signal
Processing, pages 861-864. Albuquerque, NM.
- Lunin and White, 1990
-
Lunin, L. F. and White, H. D. (1990).
Author cocitation analysis, introduction.
Journal of the American Society for Information Science,
41(6):429-432.
- MacKay, 1992a
-
MacKay, D. J. C. (1992a).
Bayesian interpolation.
Neural Computation, 4(3):415-447.
- MacKay, 1992b
-
MacKay, D. J. C. (1992b).
Information-based objective functions for active data selection.
Neural Computation, 4(4):590-604. ftp://wol.ra.phy.cam.ac.uk/pub/www/mackay/selection.nc.ps.gz. CiteSeer:
http://citeseer.ist.psu.edu/47461.html.
- MacKay, 1995
-
MacKay, D. J. C. (1995).
Developments in probabilistic modelling with neural
networks--ensemble learning.
In Kappen, B. and Gielen, S., editors, Neural Networks:
Artificial Intelligence and Industrial Applications. Proceedings of the 3rd
Annual Symposium on Neural Networks, Nijmegen, Netherlands, 14-15 September
1995, pages 191-198, Berlin. Springer.
- Mardia et al., 1979
-
Mardia, K. V., Kent, J. T., and Bibby, J. M. (1979).
Multivariate Analysis.
Probability and Mathematical Statistics. Academic Press, London.
ISBN 0124712525 [
bibliotek.dk
| isbn.nu ]
.
- Massy, 1965
-
Massy, W. F. (1965).
Principal component analysis in exploratory data research.
Journal of the American Statistical Association, 60:234-256.
- McCain, 1990
-
McCain, K. W. (1990).
Mapping authors in intellectual space: A technical overview.
Journal of the American Society for Information Science,
41(6):433-443.
- Metropolis et al., 1953
-
Metropolis, N., Rosenbluth, A. W., Rosenbluth, M. N., Teller, A. H., and
Teller, E. (1953).
Equations of state calculations by fast computing machine.
Journal of Chemical Physics, 21:1087-1091(1092?).
- Nichols, 2002
-
Nichols, T. E. (2002).
Visualizing variance with percent change threshold.
Technical note, Department of Biostatistics, University of Michigan,
Ann Arbor, Michigan, USA. http://www.sph.umich.edu/fni-stat/PCT/PCT.pdf.
- Parzen, 1962
-
Parzen, E. (1962).
On the estimation of a probability density function and mode.
Annals of Mathematical Statistics, 33:1065-1076.
- Pearce, 1982
-
Pearce, S. C. (1982).
Analysis of covariance.
In Kotz, S., Johnson, N. L., and Read, C. B., editors, Encyclopedia of Statistical Science, volume 1, pages 61-69. John Wiley &
Sons. ISBN 0471055468 [
bibliotek.dk
| isbn.nu ]
.
- Pearson, 1901
-
Pearson, K. (1901).
On lines and planes of closest fit to systems of points in space.
The London, Edinburgh and Dublin Philosophical Magazine and
Journal of Science, 2:559-572.
- Penrose, 1955
-
Penrose, R. (1955).
A generalized inverse for matrices.
Proc. Cambridge Philos. Soc., 51:406-413.
- Petersson et al., 1999
-
Petersson, K. M., Nichols, T. E., Poline, J.-B., and Holmes, A. P. (1999).
Statistical limitations in functional neuroimaging. i.
non-inferential methods and statistical models.
Philosophical Transactions of the Royal Society - Series B -
Biological Sciences, 354(1387):1239-1260.
- Rasmussen and Ghahramani, 2001
-
Rasmussen, C. E. and Ghahramani, Z. (2001).
Occam's razor.
In Leen, T. K., Dietterich, T. G., and Tresp, V., editors, Advances in Neural Information Processing Systems, Boston, MA. MIT Press.
http://nips.djvuzone.org/djvu/nips13/RasmussenGhahramani.djvu.
NIPS-13.
- Ripley, 1988
-
Ripley, B. D. (1988).
Statistical inference for spatial process.
Cambridge University Press, Cambridge, UK.
ISBN 0521352347 [
bibliotek.dk
| isbn.nu ]
.
- Rosenblatt, 1962
-
Rosenblatt, F. (1962).
Principals of Neurodynamics.
Spartan, New York.
- Roweis, 1998
-
Roweis, S. (1998).
EM algorithms for PCA and SPCA.
In Jordan, M. I., Kearns, M. J., and Solla, S. A., editors, Advances in Neural Information Processing Systems 10: Proceedings of the 1997
Conference. MIT Press. http://www.gatsby.ucl.ac.uk/~roweis/papers/empca.ps.gz. ISBN 0262100762 [
bibliotek.dk
| isbn.nu ]
.
- Salton et al., 1975
-
Salton, G., Wong, A., and Yang, C. S. (1975).
A vector space model for automatic indexing.
Communication of the ACM, 18:613-620.
- Shannon, 1948
-
Shannon, C. E. (1948).
A mathematical theory of communication.
Bell System Technical Journal, 27:379-423, 623-656.
- Specht, 1990
-
Specht, D. F. (1990).
Probabilistic neural networks.
Neural Networks, 3(1):109-118.
- Tipping and Bishop, 1997
-
Tipping, M. E. and Bishop, C. M. (1997).
Probabilistic principal component analysis.
Technical Report NCRG/97/010, Neural Computing Research Group, Aston
University, Aston St, Birmingham, B4 7ET, UK.
- Wold, 1975
-
Wold, H. (1975).
Soft modeling by latent variables, the nonlinear iterative partial
least squares approach.
In Cani, J., editor, Perspectives in Probability and Statistics,
Papers in Honour of M. S. Bartlett. Academic Press.
- Zoubir and Boashash, 1998
-
Zoubir, A. M. and Boashash, B. (1998).
The bootstrap and its application in signal processing.
IEEE Signal Processing Magazine, pages 56-76. An article
with an introduction to bootstrap that rather closely follows the Efron and
Tibshirani Bootstrap book.
Finn Årup Nielsen
2010-04-23
![$\displaystyle = \log[ \underset{\boldsymbol \theta}{\max} \, p({\bf X}\vert{\boldsymbol \theta})] - \frac{P}{2} \log(N)$](img10.png)
![$\displaystyle = \sum_{n=1}^N x(n) \exp \left[ -j \frac{2\pi}{N} (n-1)(m-1) \right]$](img96.png)